

THE METRIC THAT MAKES A FRIEND OF YOUR FINANCES.
Numbers. They can either be your friends or your enemies. Your closest chums or your fiercest foes. Believe me, it’s much easier on your health, happiness and success as a dentist if you can make the numbers your friends. But how do you go about creating this amiable relationship?
The answer, my answer, is this: if you want to change numbers from being your arch nemeses into your trusted compadres, you have to really know and have a keen understanding of them and how they apply to your dental practice. To know your numbers is to know your practice, and for that simple reason, you should grow to love them.
In the “Know Your Numbers” course that I teach with the Dr. Dick Barnes Group, I explain in great detail how to make the numbers work for you. The purpose of this article is to do a little of the same. However, since it’s impossible to sum up two full days of presentations into one magazine article, this piece will focus on some of the course’s highlights. Therefore, after reading this article, you can at least get started to a better understanding of your numbers and eventually the once-perceived numeric enemies can become not only your friends but also your allies.
A Sudden Awakening
In the course, one of the most crucial precepts that I teach is a little metric that I like to call the BAM. This is an acronym for the term, “Bare Amount of Money” (sometimes I use a more colorful phrase, too). This catchy little phrase means exactly what it sounds like. The “Bare Amount of Money” is the absolute lowest (or minimum) amount of money that a dental practice needs to generate in order to stay in business. Therefore, in order to have a successful practice, it’s the number that should form the baseline measure of your practice. If nothing else, this is the one number that you need to make your friend.
To introduce the BAM, I generally begin the conversation with a few leading questions. A crucial question is, “How much does it cost to open your practice every day?”
The response I get to the question is almost always the same . . . a deafening silence. Few, if any, dentists have ever had a re-sponse to that question. The look of discomfort that passes across their faces usually tells me all that I need to know.
The sudden silence and change in body language means one thing and one thing only—they have no idea. Generally, not one person in the room knows the answer to this question. Dentists—who are highly trained professionals and very skilled in clinical dental procedures—have absolutely no clue what it costs on a daily basis to operate their practice.
But it’s no surprise that this happens. After all, very little emphasis is placed on the topic of financial management and practice operations in dental school. Very few practicing dentists also have MBAs; so really, why would they know?
Oftentimes, a dentist might respond, “Do we really need to know that? Isn’t that why we have a front office team, a financial coordinator, and a CPA?”
My answer to both questions is straightforward and to the point—“yes and no!” Yes, you must know this information! And no, you can’t just leave this up to your office staff and CPA! Dentists are the leaders of their practice, the captains of their ships, you might say, and because of that, they must know and understand the ins and outs of the finances if they are going to chart a successful course for their practice.
Dentists can’t leave such matters to someone else. To do so seriously hinders a dentist’s ability to lead his or her practice and direct its course towards financial success. Dentists must become friends with the finances, with the numbers that so many people dread and avoid. They must know how much money is coming into their practices, where the money is going, and how the money is spent. Dentists who choose not to do so are choosing not to have financially productive practices. It’s as simple as that.
Introducing the concept of the BAM is one of my most favorite moments in all of my seminars. Once the attendees finally ‘get it,’ a light bulb goes on. Dentists begin to realize—many of them for the first time—just how little they know about the business end of their practice.
At that moment, the BAM transforms from being just a three-letter acronym into a comic strip epiphany. POW! WHAM! KA-BOOM! BAM! And then, they understand! It’s a sudden explosion of realization, the a-ha moment that catapults doctors into action. When the BAM! light bulb goes on, they suddenly realize that this concept is something that will change their careers and their practices forever. Instantly, they’re hungry to learn more.
Decoding the BAM!
Once I’ve introduced the concept of the BAM, I then give a little more insight into how the number can both be determined and applied to a dental practice. First, I explain that while the BAM is the lowest number possible that allows the business to stay afloat, this number doesn’t just mean that the practice should only break even every year without making a profit. Of course not. No business—and a dental practice is a business—should just break even. The point of having your own practice is to make a profit, right? You don’t have a dental practice just to work your guts out only to pay out all your hard-earned revenue simply to cover expenses.
Therefore, the BAM needs to be set at a level so that after all the expenses are paid, the practice makes a pre-determined amount of profit every year. Pre-determining the desired profit level is crucial. If you don’t do this, you will end up with what is left rather than what you expect. This concept is the beginning of ‘knowing the numbers’ about your practice.
Actually, there are two different ways of looking at the BAM, both of which dentists should consider when evaluating their practice: the long-term BAM and the short-term BAM. The long-term or annual BAM is the minimal amount of money that the practice needs to operate for an entire year. The short-term or daily BAM is the amount needed to operate the practice on a daily basis. Just as short-term goals help us to achieve long-term goals in other parts of our lives, daily BAMs allow dentists to achieve yearly BAMs in their practices.
In order to calculate the BAM, you need a variety of numbers at your fingertips. First, have a detailed record of your finances from the previous year. The BAM for the coming year is always based on the previous year’s figures. These figures include all of-fice-related expenses. Include such things as your personal compensation (as the owner of the practice), employee expenses, lab expenses, facility expenses, dental supplies, promotion expenses, equipment, loans, etc. Once you have all your expenses accounted for from the previous year, add them together. The total represents what it costs to operate your business. To generate revenue below this level would result in your practice showing a loss for the year, which is obviously not a good place to be.
With last year’s BAM calculated, you can calculate the BAM for the forthcoming year. Ask yourself some crucial questions about your goals for the next year: Do you want to make more money as the owner of your practice next year? Then that amount needs to be added to last year’s BAM. Do you want to make more of a profit next year for the practice overall? Then that number needs to be added to last year’s BAM, too.
Last year’s BAM + desired increased income for this year = This year’s annual BAM
Once you have the annual BAM figure determined, figure out your daily BAMs for the coming year. Remember, it’s the daily BAMs that allow you to reach the overall BAM for the year, so these numbers are crucial to know and understand. To calculate the daily BAM, look at your upcoming year’s calendar. How many days will the office be open? Be sure to deduct vacations, weekends, holidays, continuing-education days, etc. Consider including a couple of snow days if you live in an area prone to such business interruptions. Once you have that number of annual, workable days totaled, divide the yearly BAM by that number. That gives you the amount of money per day that you must make in order to achieve the desired annual BAM.
This year’s desired annual BAM ÷ total workable days = daily BAM
Make sense?
It’s all pretty straightforward. However, calculating the initial BAM can be a complex task with a series of detailed worksheets and a scrutiny of last year’s books. That’s why the “Know Your Numbers” course is so beneficial because I walk you through the process step by step. However, as promised, here are some overall tips that you can refer to immediately to evaluate the numbers of your practice.
 Focus on the Percentages
I’ve spent a lot of time writing about numbers in this article. However, when you’re looking over and evaluating your numbers, it’s crucial that you calculate the figures for each category as percentages. Why? There are two, main reasons: first, looking at numbers as percentages removes the reactionary emotion that everyone feels when they see a large dollar amount. Second, knowing the percentages for each category is essential to
truly understanding how all the constituent numbers in your BAM interrelate.
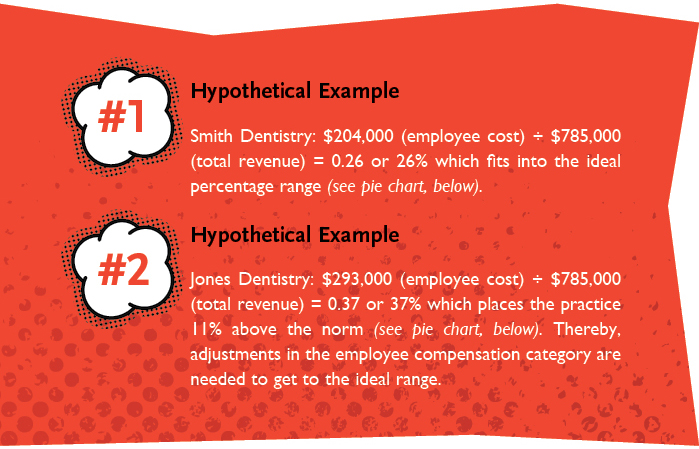
Here’s an example. First, consider the employee compensation category. Look at the total amount that it costs to pay the em-ployees in your practice including staff salaries, fringe benefits, and payroll taxes. Divide this total number by your total revenue for the year. This calculation reveals the percentage that the employee cost category consumes of your total revenue. (See Hypothetical Examples sidebar, left.)
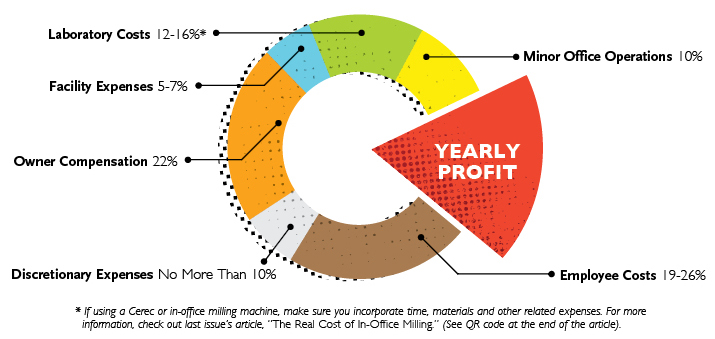
Do a similar calculation for each of the following categories: discretionary expenses, owner compensation, facility expenses, laboratory costs, and minor office operations. When you’re done calculating, you will have a good understanding of how your various types of expenses are related. The following are some ideal ranges (by expense type), based on general industry numbers that may help provide a baseline for your practice. I use these figures in a slide presentation during my seminars.
Employee Costs: 19 to 26%
Discretionary Expenses: no more than 10%
Owner Compensation: 22%
Facility Expenses: 5 to 7%
Laboratory Costs: 12 to 16%*
Minor Office Operations: 10%
When totaled, these percentages average between 78 and 91 percent. This leaves between 9 and 22 percent of available profit for the practice every year. This is the ideal. It can’t always be achieved, but it is definitely the goal to aim for.
The main reason that I suggest looking at numbers as percentages is because you will see the office’s components as a large pie graph. As with any pie graph, the pie can never go above 100 percent. So each of the categories (pieces of the pie) must fit together cohesively to equal the grand total. If you exceed in one area, you must deduct from another area. The pie graph model is an essential way to look at the practice because everyone on the team can see that each category is part of a unified whole and not an isolated piece.
 During my seminar, I strongly recommend that dentists share the numbers of the dental practice with their team. This is a crucial way for employees to understand and appreciate the goals, needs, and requirements of the practice. Many times, employees will have very little clue (like most dentists) about how much money it takes to run a practice. Sometimes, employees see the number of patients coming in for appointments and the fees that are charged to the patients and think, “Hey, this dentist is making a fortune!” By showing the employees the numbers, then they can understand the reality of what it costs to run a dental practice. Usually, employees are surprised to find out how much everything costs. Their eyes are opened and they see things as they really are.
In addition, when you show the team the breakdown of the percentages within the BAM framework, they can also see how each category fits together like pieces in the overall pie. This is beneficial for several reasons. If employees know that employee compensation should always be between 19 to 26 percent of the total revenue of the practice, then they will also know that if the practice is more successful and makes more money, the dollar amount that is involved in that percentage will also increase. For example, 19 to 26 percent of two million is a much greater dollar amount than 19 to 26 percent of 500,000. So the employees naturally ‘win’ by helping increase the overall income for the office. Get my point? This percentage perspective provides a natural incentive for teams to work harder, cut expenses in other unnecessary areas, and try to increase the amount of revenue that flows into the office. The team will thereby work harder on a daily basis to try to meet the daily BAMs because they will see a personal benefit to themselves and to the office as a whole. They know and understand the numbers because you’ve taken the time to explain them.
Another benefit involves the role that discretionary spending can have on the bottom line of a practice. In “The Real Cost of In-Office Milling,” in the Spring 2014 issue of Aesthetic Dentistry, I discussed the necessity of looking at and carefully evaluating the numbers of your practice before making any large equipment purchases for your office. This applies directly to what I’ve just described with the pie chart.
Equipment purchases fall into the category of discretionary spending. As you can see from the pie chart, discretionary spending should never be more than 10 percent. Never! So if you know the numbers for your practice, you can easily determine if you can afford that big—and potentially expensive—piece of equipment as soon as the product is pitched by a salesperson.
When you understand the BAM percentages, you can do a few simple calculations and know immediately if that piece of equipment falls under the necessary 10-percent range. If by purchasing that item, your discretionary spending rises above 10 percent, you know immediately that you can’t afford to make such an investment. By taking the BAM percentages into consideration, the office spending becomes based on logic, rather than emotion. Taking emotions out of the finances is the best thing you can do for your practice (and your life in general, for that matter).
Friends or Foes?
Understanding the numbers of your practice takes consistent effort, but it need not be complicated or time consuming. An easily understood metric like the BAM is a powerful tool that makes the numbers meaningful in your practice. By keeping your finger on the financial pulse of the office on a daily basis, you will feel the peace of mind that comes with having a business in order. You will feel the health, happiness, and success in your office that you have always hoped for. And it’s all because you decided to turn those numbers—those dreaded finances of your office—from your fiercest foes into your most valued and trusted advisors.
*For more information on how to figure out laboratory costs CLICK HERE for Dr. Downs’s article, “The Real Cost of In-Office Milling” from our Spring 2014 Issue.


